Sandbars are dynamic morphological features commonly observed on sandy beaches. They protect the adjacent beach from direct wave attack and are important expressions of sediment transport patterns in the surf zone, migrating across the shore in response to varying wave conditions. One of our research goals is to understand and model the coupling between waves, currents, sediment transport, and morphological change that results in nearshore evolution, especially sandbar migration.
During the Duck94 – CoOP experiment, fluid velocities, pressure, and seafloor location were measured at 12 locations along a cross-shore transect spaning the inner and outer surf zones, to a depth of 5 m. These observations were used to investigate cross-shore bar migration mechanisms.
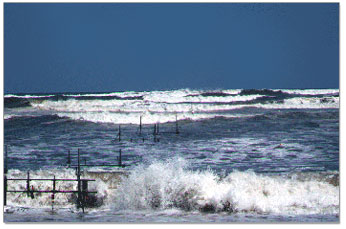
During storms, large waves break on the sandbar driving strong offshore flowing currents that move sediment and the bar offshore (A in the figure). The offshore bar migration is predicted accurately by a commonly-used model known as an ‘energetics-based sediment transport model’, which relates sediment transport to mean currents and wave velocities.
Between storms, when waves are small and mean currents are weak, the sandbar migrates towards the shore (B in the figure , but the energetics model fails to predict the observed onshore bar migration. Field observations (see also: Elgar et al. 2001.pdf) suggest that onshore sediment transport and bar migration might be related to wave-induced fluid accelerations, which are not included in the energetics model.
In the surfzone, near-breaking waves pitch forward, resulting in abrupt accelerations during the passage of the steep fronts of the waves, followed by gradual decelerations during the passage of the gentle rear of the waves. A model that relates sediment transport to such skewed accelerations predicts the observed onshore bar migration (see also: Hoefel and Elgar, 2003: abstract; full article). A combined model that includes the effects of transport by mean currents, wave velocities, and wave-induced fluid accelerations simulates both onshore and offhore sandbar migration observed over a 45-day period.
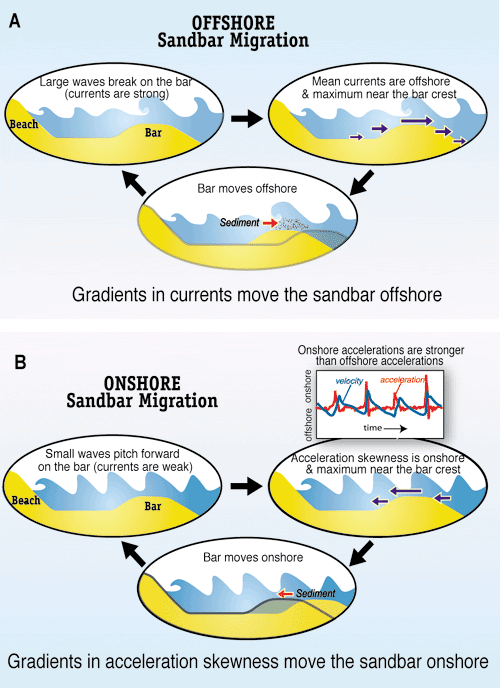
Schematics of the feedbacks between waves, currents, and morphology that drive sandbar migration. (A) During storms, large waves break on the sandbar, producing currents that transport sediment and the sandbar offshore. The location of wave breaking moves offshore with the sandbar until conditions change. (B) Between storms, small unbroken waves pitch forward on the sandbar, producing strong onshore-directed fluid accelerations (rectangular insert in panel B) that transport sediment and the sandbar shoreward. The location of the peak in acceleration-induced transport moves onshore with the sandbar until conditions change.
Field Observations
Field observations for 45 days along a cross-shore transect of the beach near Duck, N.C., suggest a relationship between onshore sediment transport, bar migration, and wave-induced fluid acceleration.
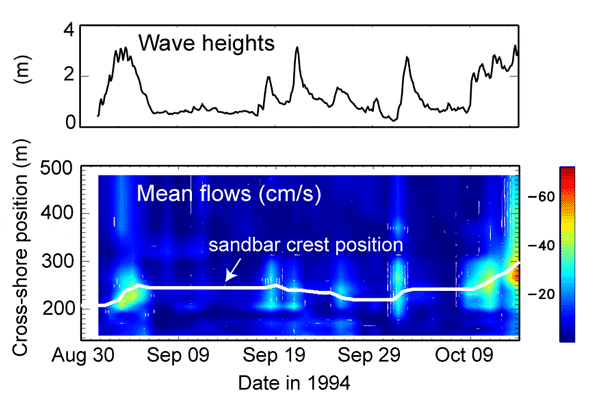
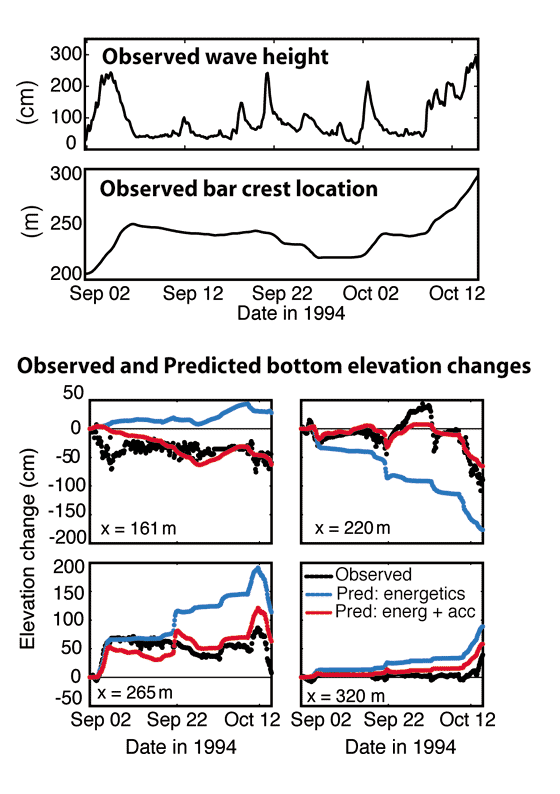
During the experiment, several storms were observed, as indicated by periods of large wave heights (observed in 5-m water depth). Strong offshore currents (yellow and red contours) near the sandbar crest are associated with stormy periods, whereas weak currents ( blue contours) are observed between storms when waves are small.
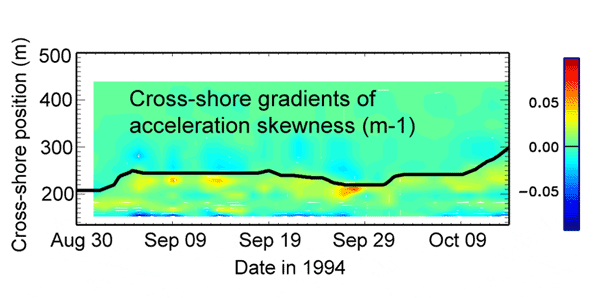
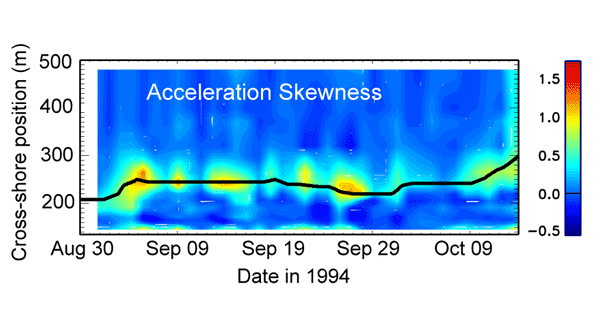
Morphological changes depend on spatial gradients of sediment transport. Cross-shore gradients of acceleration skewness are negative offshore of the bar crest (light blue contours) and positive onshore of the bar crest (yellow and red contours), consistent with erosion offshore and accretion osnhore of the bar crest. Net onshore sediment transport and bar migration are observed when mean currents are weak and the effect of skewed accelerations dominates sediment transport in the surf zone.
Model Results
A sediment transport model that accounts for the effects of skewed fluid accelerations in waves initially was derived based on discrete-particle numerical simulations (Drake & Calantoni, JGR 106, 2001). The model was later extended to account for random waves in a natural surfzone and tested with field observations.
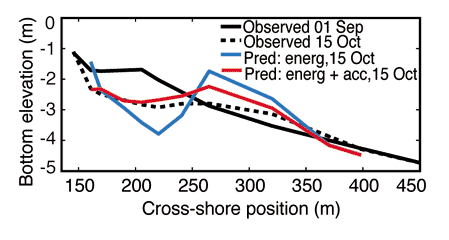
To model both onshore and offshore sediment transport, the acceleration-driven model was combined with the energetics model to predict sediment transport patterns and cross-shore bar migration over a period of 45 days, during which the bar moved both offshore and onshore (bar crest location in figure below) in response to large and small waves (wave height in the figure below).
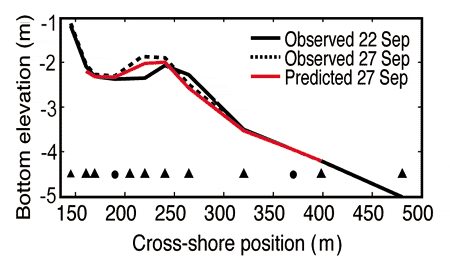
Between Sep 22 and Sep 27, 1994, the sandbar migrated onshore approximately 30 m. The wave-acceleration driven sediment transport model predicts the observed profile changes, whereas the energectics model does not predict any changes. The symbols are cross-shore locations of instruments that were deployed close to the seafloor along the transect.
