Vannevar Bush Faculty Fellowship: Learn More
The objectives are to use remotely sensed images of the sea surface in littoral areas (Figure 1) to:
- Test the hypotheses that energetic, few-meter-scale motions are (i) important in littoral areas, (ii) provide a mechanism for both 2D and 3D turbulence, and thus (iii) must be included in models, and
- Develop field-tested models that predict littoral processes on short spatial (few meter) and temporal (few minute) scales.
Anticipated results include:
- Understanding and modeling of the physics of energetic, small-scale (< 5 m) motions (the “nearshore mesoscale”) in littoral regions, and
- Significantly higher-resolution field-tested numerical models of littoral processes.
The approach is to combine remotely sensed and in-situ observations with numerical model simulations. The in-situ observations provide both ground truth for the remote observations and a means to test and improve models.
Field Observations:
In-situ and remote [lidar (Figure 2), infrared (Figure 3), optical sensors (Figure 4)] observations are obtained in littoral areas with breaking waves and complex circulation patterns.
Physics and Numerical Models:
High spatial- and temporal-resolution phase-resolved (e.g., Boussinesq) numerical models are used to address hypotheses, and to develop algorithms to predict flows given images of the surface.
Analysis:
Techniques used to estimate flows from images include particle image velocimetry (PIV) and feature tracking algorithms. Nonlinear interactions that transfer energy to smaller and larger spatial scales are quantified with higher-order spectra, in both frequency and spatial domains.
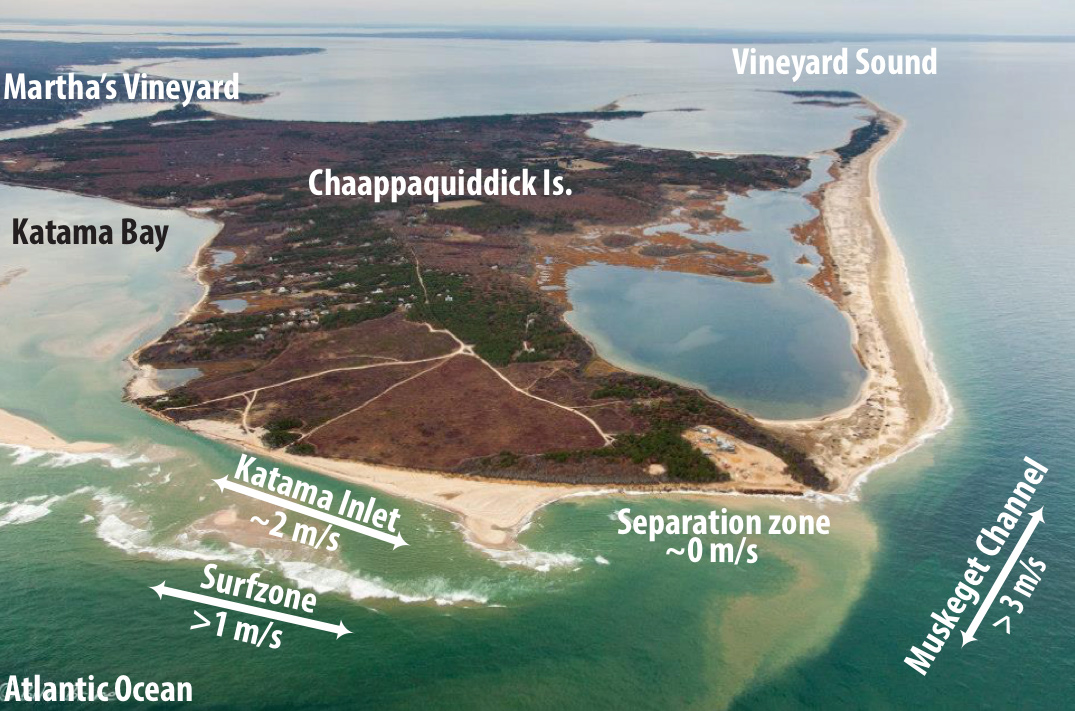
Figure 1: Optical image of Chappaquiddick Is. and the southern shore of Martha’s Vineyard showing Muskeget Channel (tidal flows > 3 m/s) connecting Vineyard Sound and the Atlantic, Katama Inlet (flows ~ 2 m/s), the surf zone (flows > 1 m/s), and a flow separation zone where currents are small.
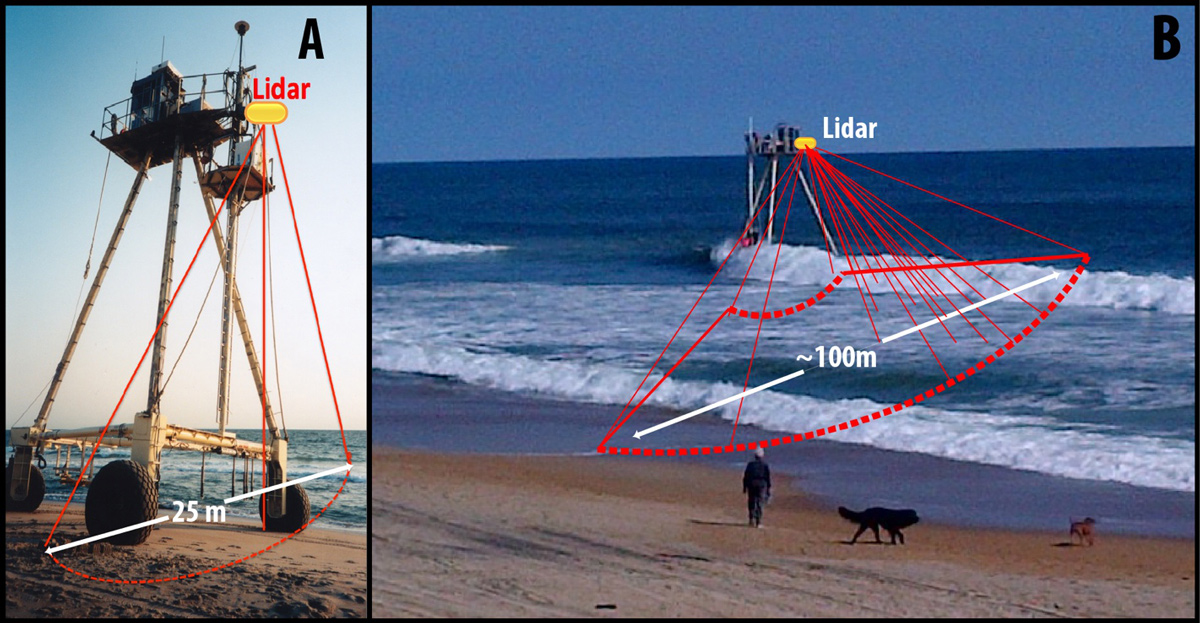
Figure 2: (a) The 9-m tall amphibious CRAB on the beach at the USACE FRF, Duck, NC. Two lidar (laser) sensors are mounted near the top of the vehicle (yellow oval) and (b) the CRAB in the surf zone. The area imaged by the lidars is outlined by the red arcs.
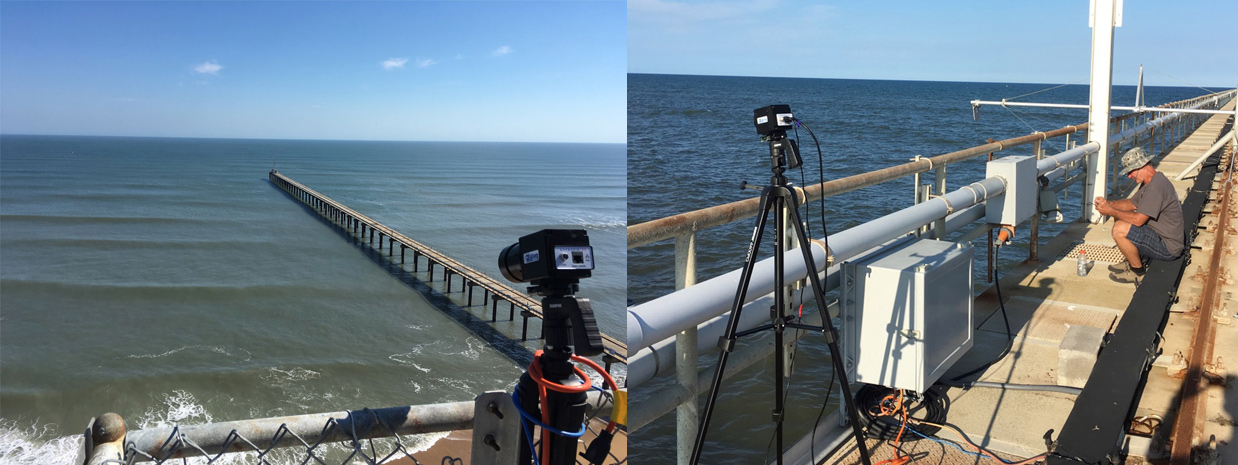
Figure 3: Infrared (IR) cameras on (left) a 40-m tall tower and (right) a pier at the USACE Field Research Facility, Duck, NC.
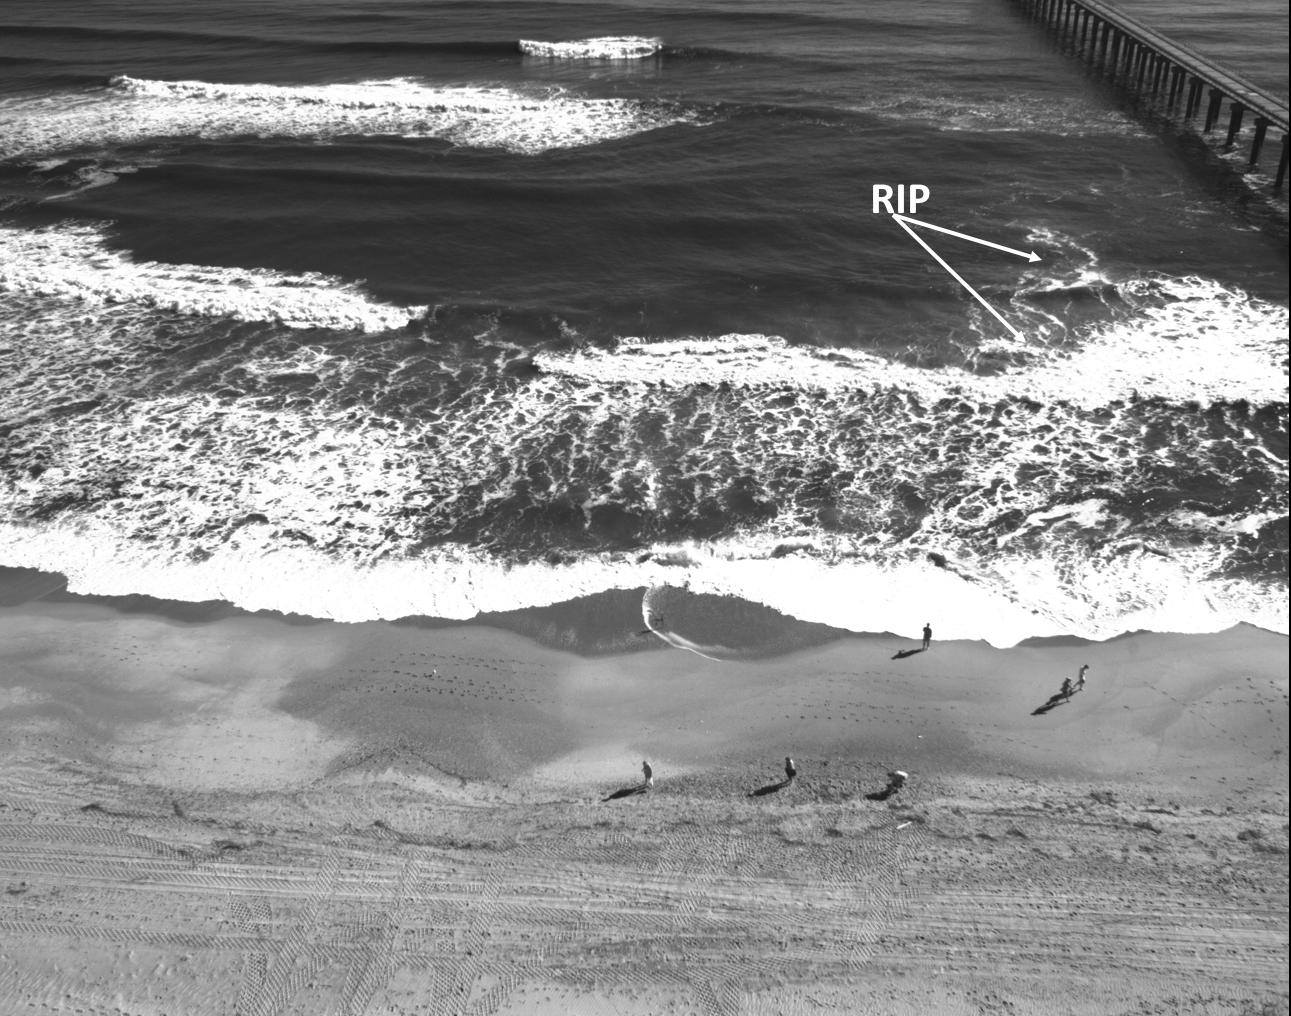
Figure 4: An optical image of the surfzone at Duck, NC. The white foam carried offshore by the rip current was easily detected and followed by eye as we walked along the pier to time it (speed ranged from 0.5 to 1.0 m/s), and is quantified using particle image velocimetry from rapid sequences of images.
Funding by
by the Vannevar Bush Faculty Fellowship program in the Office of the Assistant Secretary of Defense (Research and Engineering)
![]()