The long-term objective is to understand the coupling and feedback between waves, currents, sediment transport, and evolving morphology so that maps of the seafloor can be made from remotely sensed information, and so that the maps can be updated with numerical models.
Large perturbations will be made in the nearshore seafloor and waves, currents, sediments, and bathymetry will be monitored as the system evolves and returns to an equilibrium configuration. The perturbations or manipulations of the seafloor will include:
1) DREDGING a gap across a sandbar to generate a rip current (a pilot test demonstrated that a gap in a sand bar can be created and will affect surfzone waves and currents). See Figure 1
2) DIGGING crater-like holes in the beach to act as a gigantic sediment trap (a pilot test demonstrated that large holes can be dug at low tide, and instrumented before the tide rises and waves attack the crater). See Figure 2
3) EXCAVATING a channel across a tidal flat to observe its evolution.
Plans for Perturbations
Several experiments will be performed in which bathymetry (the system response) will be measured before, during, and after the seafloor is perturbed (the impulse). Waves and currents (the forcing) will be observed offshore, alongshore, and within the perturbations. Based on pilot tests (Figure 1), it is hypothesized that the seafloor may begin to evolve immediately, thus requiring rapid deployment of wave and current sensors, and continuous surveying. Although risky because the surfzone can be a difficult environment in which to work, our team was able to deploy pressure gages, current meters, and altimeters within a man-made hole before it was submerged by the rising tide (Figure 2). Similar sensors and deployment techniques will be used to instrument a gap dredged across a sandbar (Figure 1) and channels created in a tidal mud flat.
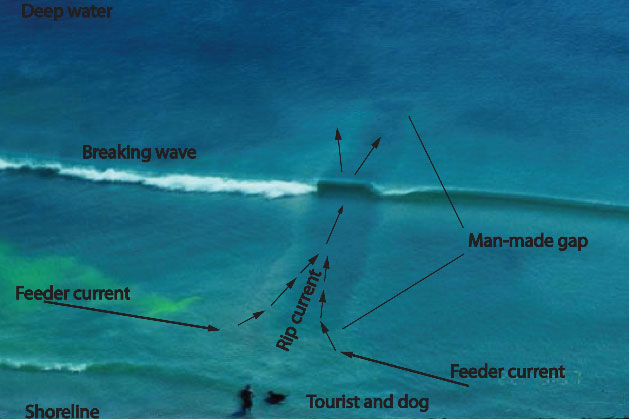
Figure 1: Photograph of a 2-m wide, 1-m deep gap made across a sandbar with an excavation blower on an amphibious vehicle, Visually observed (green is dyed water) currents are shown schematically by the arrows. The gap in the sandbar closed within a few days when obliquely incident waves generated an alongshore current. The gap was created at the US Army Corps of Engineers Field Research Facility at Duck, NC.
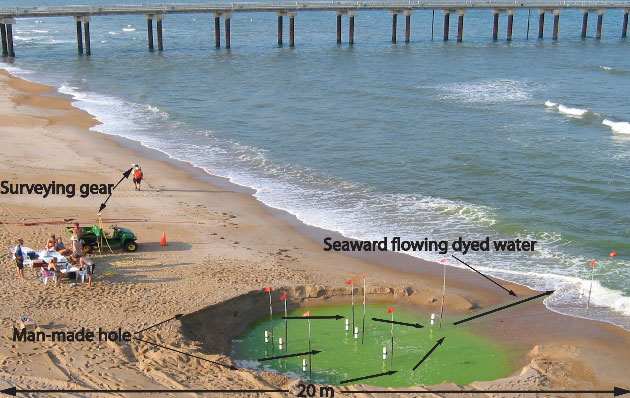
Figure 2: Photograph of a 10-m diameter, 2-m deep hole made with a backhoe near the low-tide water line. Visually observed (green is dyed water) currents are shown schematically by the arrows. The bathymetry within and near the hole was surveyed continuously as the tide rose, submerging and eventually refilling the hole with sand. The hole was dug at the US Army Corps of Engineers Field Research Facility at Duck, NC.
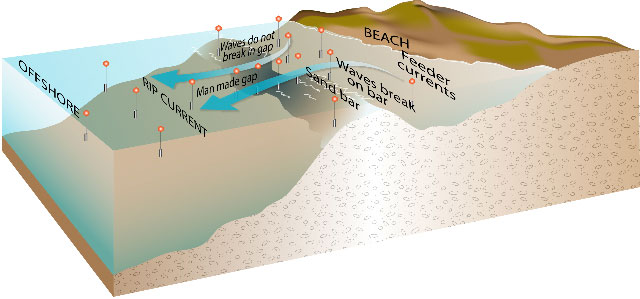
Figure 3. Schematic of instrument layout to monitor the currents and morphological evolution associated with a man-made gap in a sandbar in the surfzone. The gap will be dredged with a specialized boat. The symbols are acoustic Doppler velocimeters (ADVs) colocated with pressure gages to measure currents and waves. The ADVs will be mounted looking down, and locate the nearest boundary (eg, the seafloor) at the start of each hour-long data run, providing nearly continuous surveys of the evolving sand level. GPS-based equipment mounted on a personal watercraft will provide spatially dense larger-scale surveys before the gap is created, and several times daily as the gap evolves.
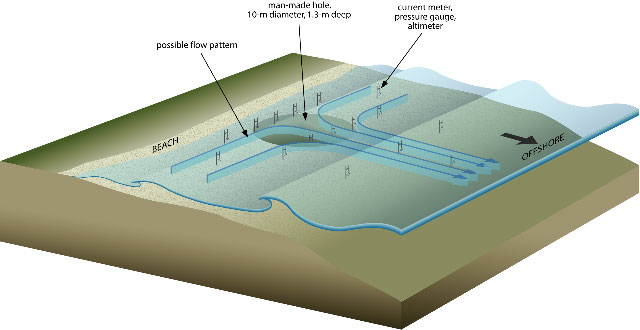
Figure 4. Schematic of instrument layout to monitor the evolution of a hole in the beach. The 1- to 2-m-deep, 10-m-diameter holes will be made with a backhoe at low tide. The symbols are acoustic Doppler velocimeters (ADVs) colocated with pressure gages to measure currents and waves. The ADVs will be mounted looking down, and locate the nearest boundary (eg, the seafloor) at the start of each 8.5 min data run, providing nearly continuous surveys of the evolving sand level. GPS-based equipment will provide spatially dense larger-scale surveys before the hole is created, and several times daily as the hole evolves.
After dredging a gap across a sandbar, SCUBA divers rapidly will deploy current meters and pressure gages onshore, within, and offshore of the gap to monitor waves and currents (Figure 3). The bathymetry will be surveyed often with jet skis equipped with sonar and GPS, and hourly with the current meters.
To investigate further the coupling between fluid forcing and morphological response, a second set of perturbation experiments will simulate the effects of large circular holes placed in the beach during mine and obstacle clearing operations. It is unknown how these holes or craters behave, how long they persist, and how rapidly they refill. By creating several man-made holes we will be able to determine their behavior as a function of location on the beach and wave and sediment conditions, and to test numerical models for a different, but equally challenging situation.
In addition, the hole may act as the world’s largest man-made sediment trap, allowing a sediment transport rate to be determined.
The techniques necessary to create and instrument a large hole before the tide rises were perfected during a pilot project (Figure 2). Large holes in the beach will be made with a backhoe (we prefer to use a JDAM, but the permitting issues would be a nightmare!). Waves, currents, and sand levels will be monitored as the water rises and the holes are subjected to waves. To compare and contrast swashzone (the most shoreward region of the beach that is alternatively covered and uncovered by waves) and surfzone processes (unbroken, breaking, and broken waves, surface- or bottom-generated turbulence, cross- or alongshore currents), one hole will be made on the upper part of the beach that is in the swashzone at high tide (and dry at other times), and one hole will be made lower on the beach so it is within the surfzone at high tide. Both holes will be dug at low tide, with the excavated sand deposited away from the hole in a location above the most shoreward extent of wave runup.
A dense array of sensors will be deployed across and surrounding the hole (Figure 4). Additional sensors will be deployed offshore of the hole to measure incident waves (needed for model initialization and determination of model coefficients), and alongshore of the hole to monitor currents that flow toward or away from the hole.
Anticipated Results and Contribution to NSSEFF program goals:
Operations in the littoral region require accurate and up-to-date maps of the seafloor. However, the bathymetry in this dynamic area can change rapidly. Strong currents can move sandbars hundreds of meters in a few hours. Craters created during mine- and obstacle-clearing operations can generate strong currents, and can cause rapid and significant sediment transport, burying objects in its path, while exposing those left in its wake. River channels in estuaries and on tidal flats grow and shrink, as well as change shape and depth in response to tides and currents, making routes for safe ingress and egress difficult to determine, and resulting in grounded vessels and vehicles. Although remote sensing allows denied areas to be mapped in some detail, models are required to update the maps with predictions of subsequent changes to the bathymetry. A primary result of this project will be better models to predict the evolution of littoral bathymetry from its initial, remotely sensed configuration. The perturbation studies proposed here will result in a better understanding of the nonlinear dynamics that govern the coupling and feedback between fluid forcing and morphological response in shallow water, leading to improved models. The observations also will provide in situ information for ground truth of remote sensing devices, as well as a unique database to challenge numerical models.
Although the focus is on the littoral region, the techniques and results from this project can be used to learn about other nonlinear systems. Similar to previous studies, the signal processing techniques developed here may find a wide range of applications. For example, work on higher-order spectral analysis has led to applications throughout oceanography, as well as in image processing, medical diagnoses, pattern recognition, mechanical systems and vibrations, pulsars, and even interpretation of 3-million year-long time series from ice cores.
Data Download
Please fill out the below form to access data files.
"*" indicates required fields
Funded by
Office of Secretary of Defense National Security Science and Engineering Faculty Fellowship