Our objective is to develop field-verified models for circulation, sediment transport,
and morphological change on macrotidal flats.
To attain this goal, as part of the Tidal Flats Dynamics Departmental Research Initiative (tidalflats.org), we are collecting observations of flows, tides, waves, water density, and bathymetry across the Skagit Bay tidal flats.
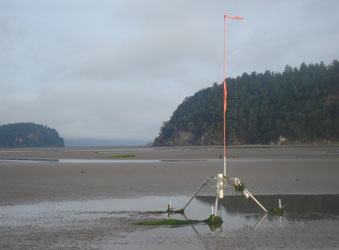
Figure 1: Fluid velocities, water levels, waves, and water density were measured with sensors mounted on tripods at 11 locations over a 1.5 by 2.5 km region of the flats in summer 2008.
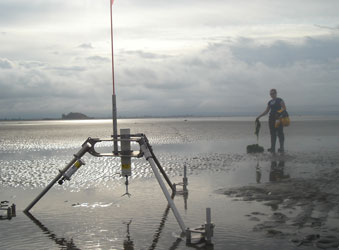
Figure 2: Sensors and tripods were cleaned almost daily at low tide to prevent fouling by seagrass and kelp.
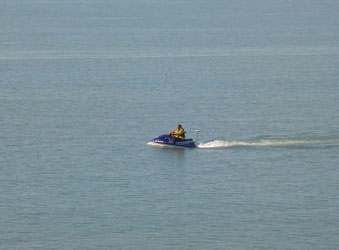
Figure 3: A waverunner/GPS survey system was used to map the seafloor over a roughly 4 km by 3 km region of the tidal flats.
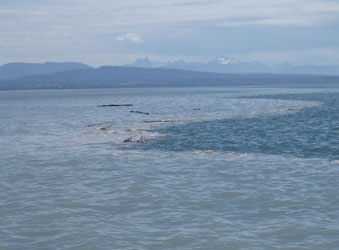
Figure 4: Strong river discharges resulted in fronts made visible by foam, debris, and changes in water temperature, salinity, and turbidity.
Bathymetry
2008
Map of seafloor level measured during summer 2008 with the waverunner/GPS system. Observations were collected on alongshore transects separated by roughly 100 m in the cross-shore. For more information about the survey system, please see the Truro page.
2009
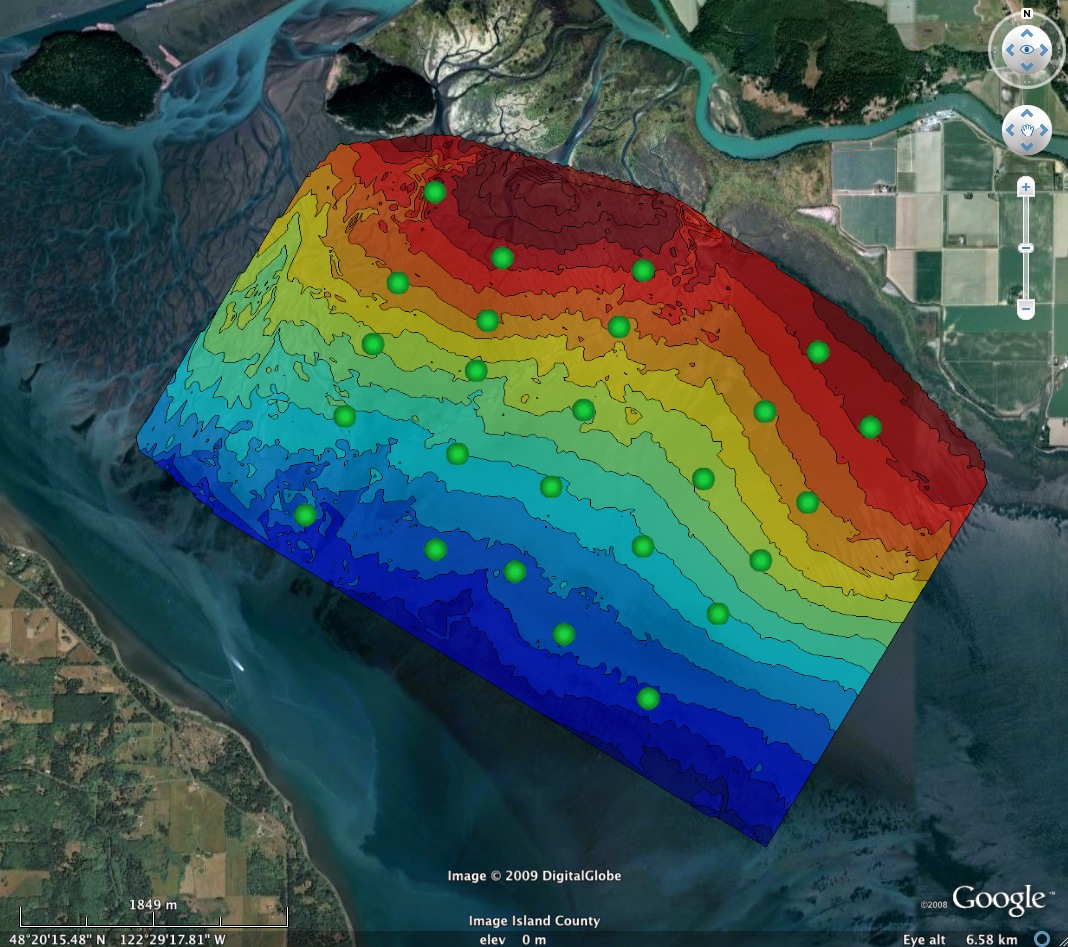
Map of seafloor level measured during summer 2009 with the waverunner/GPS system and the 2009 tripod locations (green circles). Observations were collected on alongshore transects separated by roughly 100 m in the cross-shore, on cross-shore transects separated 100 to 200 m in the alongshore, over a mini-grid, and along the cross-shore instrument transects.
Field Observations
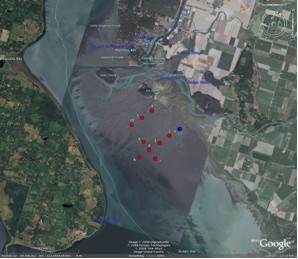
Locations of collocated current meters, pressure gages, and conductivity-temperature sensors deployed during the 2008 pilot experiment
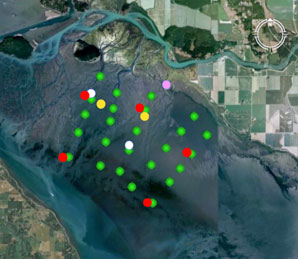
Approximately 5 by 5 km array of 25 bottom-mounted tripods (green symbols, each with an acoustic current meter, pressure gage, and CT sensor), 2 meteorological stations (white), 5 colocated current profilers and floating CTD stacks with sensors about 20 and 70 cm below the water surface (red), and 2 colocated current meters and pressure gages (yellow) deployed in 2009. A meteorological station also was deployed on Craft Is. by J. Thomson (UW-APL) (pink).
Data Download
Please fill out the below form to access data files.
"*" indicates required fields
Funding by
![]()

The instruments were deployed, maintained, and recovered by Bill Boyd, Levi Gorrell, Erika Ladouceur, Vera Pavel, and Evan Williams.