Bathymetry will be available to NCEX investigators for pre-experiment model runs and experiment design. Bathymetry hand digitized from pre-1990’s maps is available and modern bathymetry is being acquired in 2001.
LaJolla Canyon and Scripps Canyon
Scripps Canyon is a narrow gorge about one mile long with three main branches: North, Sumner and South Branches. All three heads can be traced into the coastal cliffs as incised land canyons. Scripps Canyon is cut into calcareous and noncalcareous mudstone and sandstone of the Eocene Ardath Shale
(formerly Rose Canyon Shale), including a large amount of conglomerate, as seen in the sea cliffs to the north. Scripps Canyon has precipitous, narrow, sometimes overhanging rocky walls nearly its entire length, with some sections so narrow that submersibles cannot descend to the bottom. Canyon walls can have scoured and grooved surfaces under the overhanging walls, showing that active erosion is taking place.
La Jolla Canyon is wider than Scripps Canyon and has at its head a series of gullies cut into semi-consolidated Pleistocene mud with invertebrates boring and burrowing in the mud. Lower down, La Jolla Canyon cuts through Eocene and Cretaceous rocks. La Jolla Canyon has a wide bowl near the head, but a much narrower rock gorge with steep walls is entered at 400 feet.
A littoral cell is a stretch of coastline containing a complete sedimentation cycle that cycles sand on and off the beaches. Bounded by the beach on one side and extending seaward to just beyond the area of breaking waves, a littoral cell is the region where wave energy dissipates. Sediments from rivers and from coastal erosion as well as plant detritus and garbage are moved southward along the coastline from Dana Point to La Jolla within the Oceanside Littoral Cell, until these materials encounter the heads of the Scripps and La Jolla Submarine Canyons. These sediments are transported down the canyons, sometimes as rapidly-moving turbidity current flows which further erode the canyon floors and walls. Both canyons have extensive detrital mats, particularly in their shallower reaches, consisting of surfgrass and kelp detritus and supporting a natural macrofaunal community whose combined density is an order of magnitude larger than that reported anywhere else in the world.
Scripps Canyon joins La Jolla Canyon at a depth of about 900 feet, and the two continue seaward as a rock-walled canyon to about 1,600 feet, where a fan valley cut into unconsolidated sediment is encountered. Both canyons have a series of steps along their axes, some with rock lips with a vertical drop of ten feet or more, whereas others have steep sediment-covered slopes a few feet high, suggestive of landslide scars.
The submarine fan emptying from La Jolla Canyon into the San Diego Trough is creased by a steep-sided valley that hooks south. Complex natural levees are present continuously along the right bank of the valley but poorly developed along the left except for the outer third. Terraces are well developed in the central portion adjacent to the inner channel, are intermittent and at variable heights in the middle portion, and are inconspicuous along the outer valley. The valley lacks distinct distributaries, although remnants may exist along the outer part. There are precipitous walls along the outside of the bends of the winding channel. Slumping is taking place actively from these walls and large slump blocks of clay are common on the floor.
How does the sediment mixed with detritus on the canyon bottoms flush out occasionally? Dr. JH van den Berg of the Department of Physical Geography at Utrecht University offers this explanation:
Breaching is defined as the gradual retrogression of a very steep subaqueous slope, steeper than the angle of repose in clean, fine sand. Before particles on a steep slope can be entrained by gravity, their packing has to be changed from a dense to a loose state. As a result negative pore pressures are created in the bed which increase shear resistance and therefore retard erosion. This effect is only important in case the negative pressure is released slowly, thus at relatively low permeability in fine sands combined with a high erosion rate. In the case of gravity, due to shear dilatancy and resulting negative pore pressure, steep slopes up to vertical can exist for some time in fine sands. These breaches retrograde at a velocity in the order of mm/s, dictated by permeability. Two types of breaches are distinguished, (I) with or (II) without a hydraulic jump. Type II breaches retrograde in steep bar slopes. In nature the steep slope may be left behind by the scar of a slide. This type of breach produces a quasi-steady turbidity current. Sustained low energy conditions indicated by thick, massive sand layers preserved in ancient tidal sediments suggest deposition by such a breach generated flow. In contrast to a liquefaction flow slide, a breach retrogrades slowly and may be active for a number of hours. Modern channel bank failures of sands may last for hours, suggesting that breaching is a rather common type of failure in some environments. The periodic ‘flushing’ of sands from the heads of submarine canyons may also be related to the breaching process. The origin of sustained quasi-steady high-density turbidity currents suggested by the occurrence of massive sandstones in ancient deep-water turbidite successions can be explained in this way. Such canyon breaching fits well with the observation that not all canyon tributaries flush when a storm hits, and that periods of strong waves only occasionally seem to be followed by a flushing event. Since breaching follows from local slope oversteepening, it can explain the erratic nature of these events in time and space. [van den Berg, JH, 2001 personal communication, & Sedimentology 49(1):81-95, 2002 .
Extraordinarily high secondary productivity is fueled by the kelp and surfgrass detritus at the head of the La Jolla and Scripps Canyons. What’s secondary production? The energy-rich organic material (biomass) created through photosynthesis and embodied within the photosynthetic organisms is consumed and converted into other forms. The biomass of these organisms eating the photosynthetic organisms constitute secondary production. A study examined the surfgrass and kelp detrital mat on the floor of La Jolla and Scripps Canyons. Crustaceans inhabited this mat, achieving densities of more than three million individuals and biomass exceeding one kilogram (dry weight) per square meter at times. The combined maximum density of these animals was 3,240,000 individuals per square meter, an order of magnitude greater than any natural macrofaunal assemblage reported in the literature. Fish prey on these detrital mat crustaceans and are thus the tertiary predators in this ecosystem. Localized productivity hotspots in underwater canyons may be an important energy supply for fish production along some coasts [Vetter, EW. “Hotspots of benthic production.” Nature 372(6501): 47, 1994].
La Jolla and Scripps Canyons are among the most studied submarine canyons in the world. Though Monterey Canyon is now more studied, La Jolla and Scripps Canyons were historically the most studied submarine canyons due to their proximity to Scripps Institution of Oceanography. La Jolla Canyon’s fan valley was the location of the world’s first oceanic drillings, using a drilling barge CUSS I, in March 1961. Five drilling cores to a maximum depth of 1,035 feet below the seafloor were drilled and retrieved at a depth of 3,111 feet in the La Jolla Canyon Fan Valley, where the channel is meandering with raised levee-like ridges and steep banks on the outside of each curve. Contemporary knowledge on the development and maintenance of submarine canyon systems is based on seminal research conducted in these canyons.
La Jolla & Scripps Canyon System Maps
La Jolla and Scripps Canyons and LJ Fan Valley
Shepard and Buffington’s map showing the complete canyon system down to its termination in the San Diego Trough. Contours in fathoms.
La Jolla and Scripps Canyons
Shepard’s classic map, published in many places, in several sizes. Contours in feet.
Elgar et al’s map produced from old charts for their Nearshore Canyon Experiment presentation
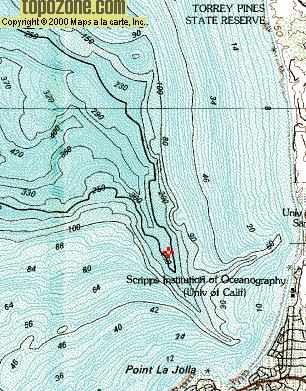
TopoZone US Geological Survey online map of the canyons.
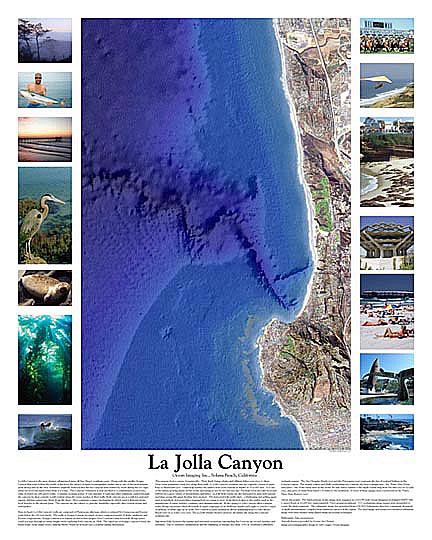
About this image, Ocean Imaging says “The land portions of this image were acquired on 11/11/99 with Ocean Imaging’s 4-channel DMSV MK-1 sensor flown at 10,000 feet (approximately 5 foot ground resolution). 172 overlapping image frames were mosaicked to create the final composite. The submarine image was generated from a NOAA bathymetry data base containing thousands of depth measurements compiled from numerous surveys of the region. The land image and perspective-rendered submarine image were then merged using digital image processing techniques.” Contact the Birch Aquarium at Scripps about purchasing this poster.
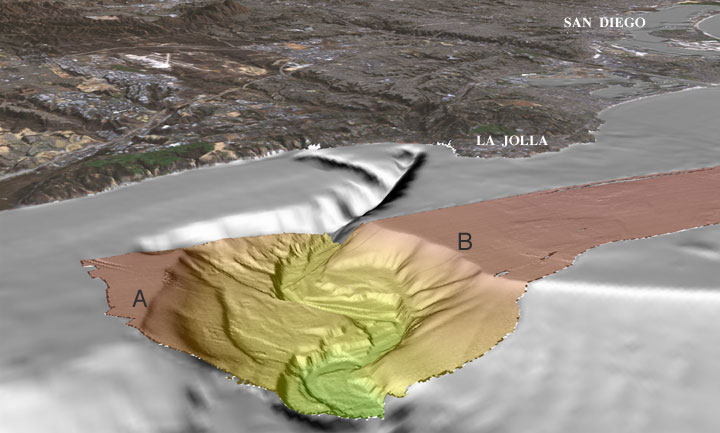
US Geological Survey Western Region Coastal & Marine Geology San Diego Margin: Perspective View 5 view of the San Diego multibeam bathymetry (colored) looking southeast at the head of La Jolla Canyon. This profile shows the cross- section of the canyon from A to B. The lower resolution bathymetry data (gray) is created from NOAA, National Ocean Service, hydrographic survey data. The land imagery in the background is a combination of Landsat-7 imagery and USGS DEMs. The distance across the bottom of the image is about 8.5 km. The vertical exaggeration is 2X. USGS provides a 16MB TIF (!), and here is another size of this image. Originals are at walrus.wr.usgs.gov/pacmaps/sd-pers5.html
Scripps Canyon Maps
-

- Dill’s map shows North, Sumner, & South Branches (from right to left). Reduced size from original. Contour interval is five meters. Submarine canyons and other sea valleys. Francis P Shepard & Robert F Dill. Chicago : Rand McNally, 1966. published in reduced size on p.39; large size in SIO Library map collection
-

- Here’s a look at North Branch in the same Dill map without size-reduction from the original. Contour interval is five meters.
-

- Here’s a look at Sumner Branch in the same Dill map without size-reduction from the original. You can see a less well defined South Branch pointing down in the middle. Contour interval is five meters.
-
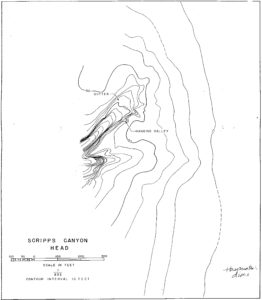
- Unattributed map in SIO Library map collection shows Sumner Branch. Contour interval is ten feet.

-

- Shepard’s block diagram of the head of Sumner Branch of Scripps Canyon. Editor’s Note: When the sediment and detrital flushes out, Sumner head can look very different, with narrow, winding, clean swept channels in its upper reaches. Bulletin of the Geological Society of America 60:1597-1612, 1949
-

- Moriarty’s sketch from Murray’s descriptions and sketches, looking towards the beach with South Branch on the right and Sumner Canyon head bisected at the left. Submarine Geology. F Shepard. New York : Harper & Row, 1963
-

- Dill’s cross-section of Scripps Canyon showing the overhanging walls, the smooth surfaces due to creeping sediment, and the irregular surfaces above the sediment fill where organisms grow and work on the walls. Contemporary Submarine Erosion in Scripps Submarine Canyon. RF Dill. Scripps Institution of Oceanography Dissertation, 1964
-
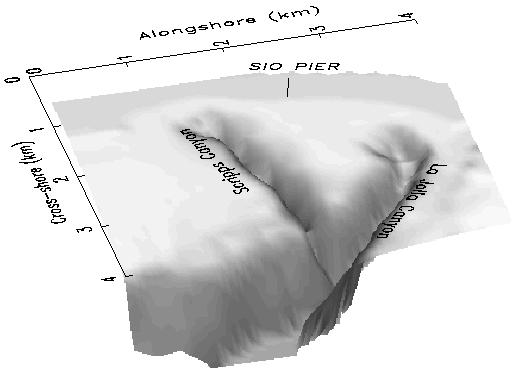
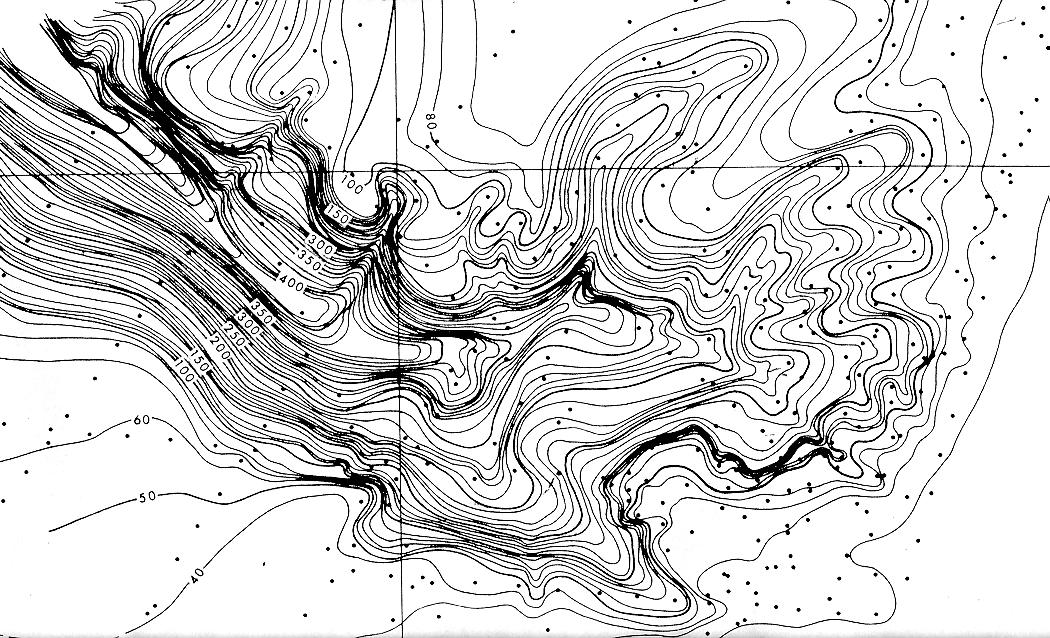
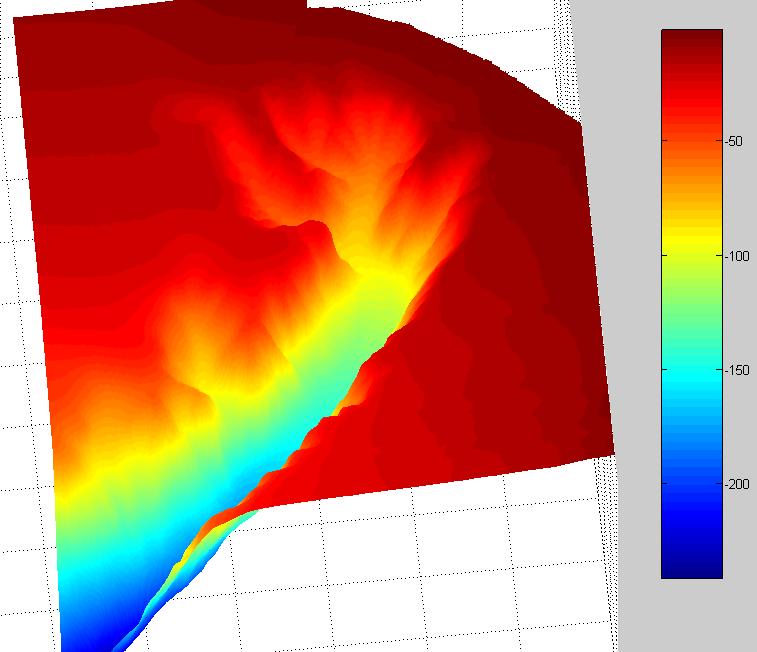
- Customized do-it-yourself three dimensional image produced from Nearshore Coastal Experiment data, using Matlab. Datapoints are gridded with a resolution of 0.15 x 0.15 seconds (4.6 meters/15 feet). Depths in meters. Produced by Peter Brueggeman

La Jolla Canyon Maps
Head of La Jolla Canyon
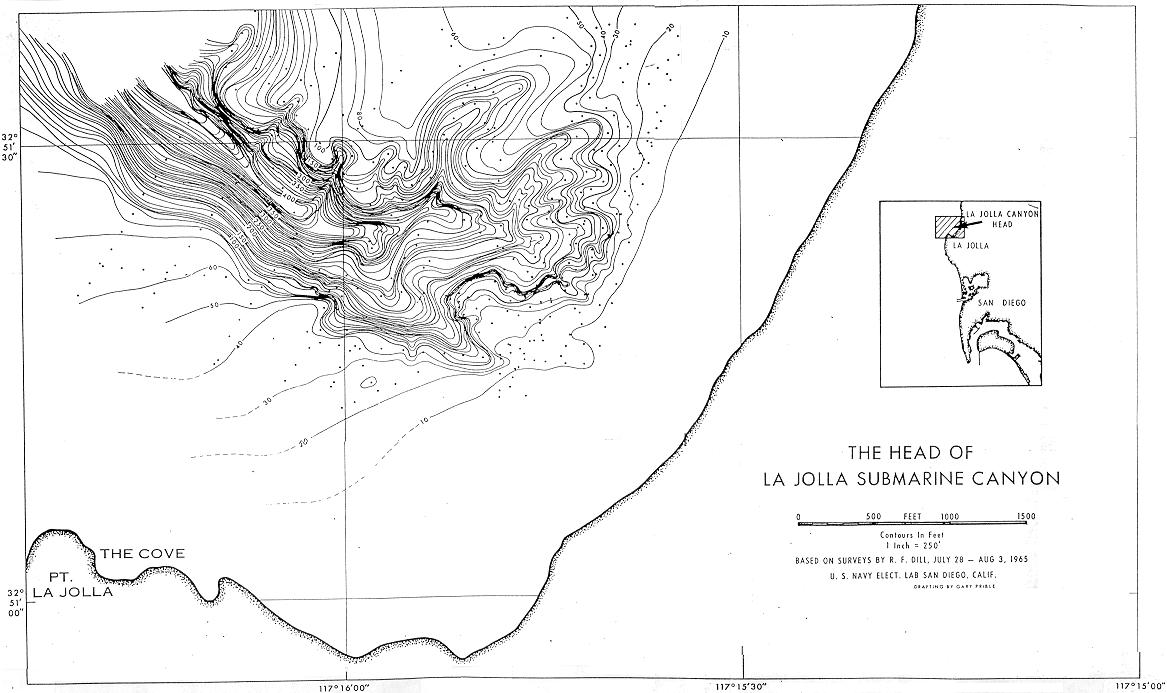
Dill’s 1965 map is expected to differ a bit from what one would see today due to the slumping nature of that canyon head. Reduced size from original. Contour interval is ten feet.
Head of La Jolla Canyon: Closer View
Here’s a look at La Jolla Canyon head in the same Dill 1965 map without size-reduction from the original. It is expected that the canyon head map will differ a bit from what one would see today due to slumping. Contour interval is ten feet.
Head of La Jolla Canyon: John Moore’s Dive Site Annotations
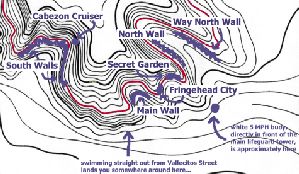
John Moore (DiveBums website) annotated Shepard’s map with dive sites. Contour interval is ten feet.
Head of La Jolla Canyon: La Jolla Ecological Reserve Study
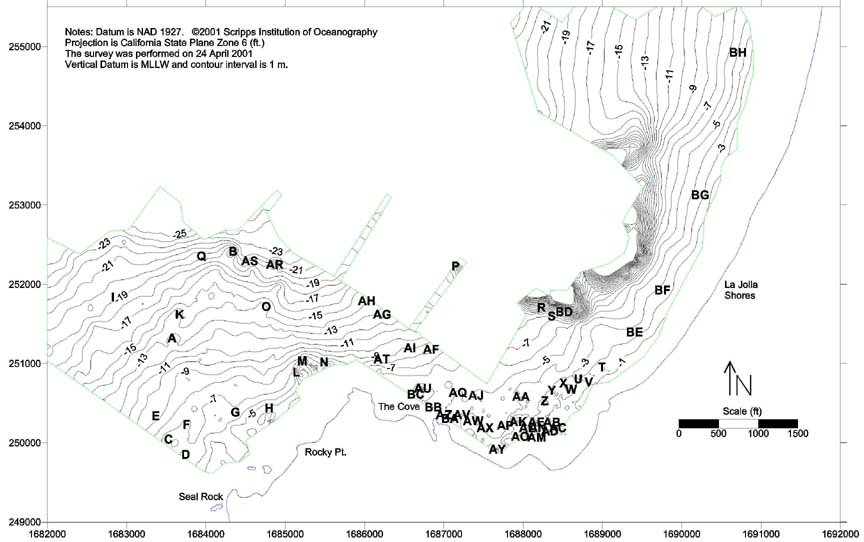
La Jolla Ecological Reserve Study map with GPS study sites. Contour interval is one meter.
Map Coordinates Canyon Sites: set GPS to the NAD 83 datum. If GPS doesn’t have NAD83 datum, tset it to WGS 84 datum.
| Site | Latitude | Longitude |
| P | 32-51-20.66988 | 117-16-10.52781 |
| R | 32-51-15.60993 | 117-15-57.76733 |
| S | 32-51-14.55358 | 117-15-56.27218 |
| BD | 32-51-15.11297 | 117-15-54.42639 |
| BE | 32-51-12.66246 | 117-15-44.00460 |
| BF | 32-51-17.95298 | 117-15-39.92595 |
| BG | 32-51-29.87221 | 117-15-34.49172 |
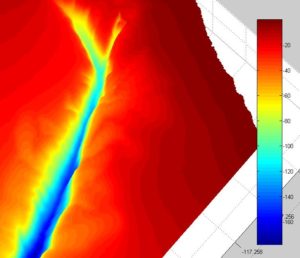
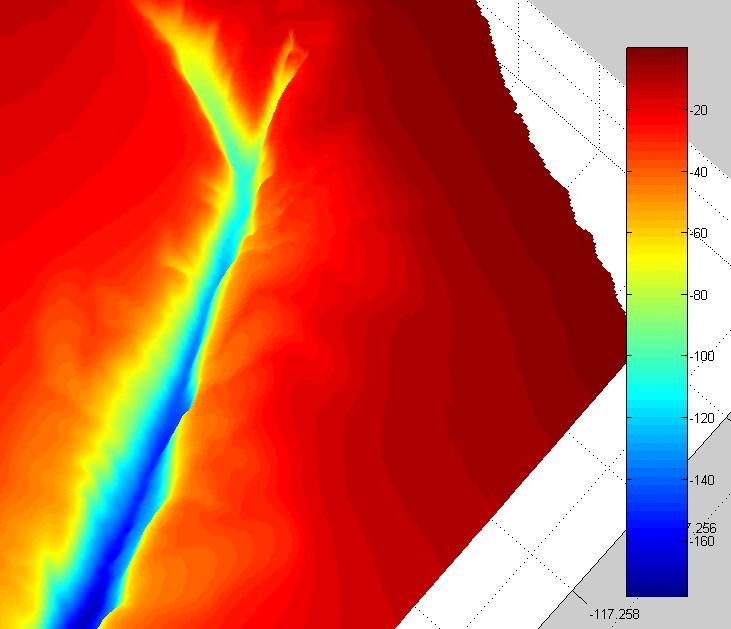
3-D of La Jolla Canyon

Customized do-it-yourself three dimensional image produced from Nearshore Coastal Experiment data, using Matlab. Datapoints are gridded with a resolution of 0.15 x 0.15 seconds (4.6 meters/15 feet). Depths in meters.
Produced by Peter Brueggeman
Canyon Wave Refraction Maps
Scripps Canyon Wave Refraction
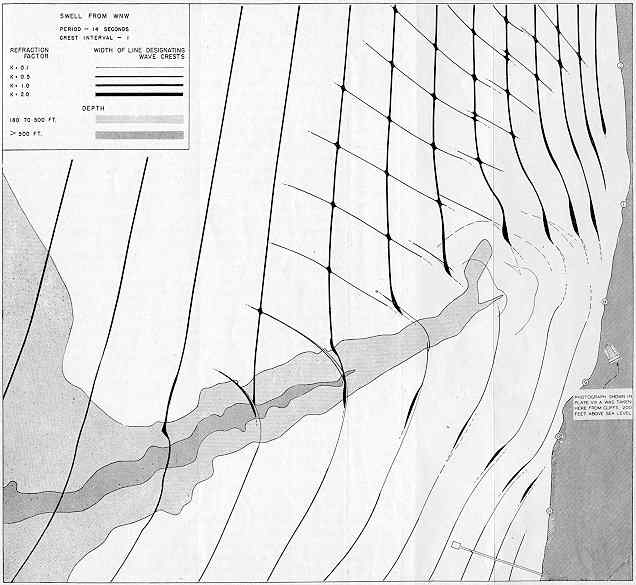
This wave refraction diagram shows how the steep bottom features of Scripps Canyon can break up a wave train into a complex pattern. One can see why the waves are larger at the Black’s Beach break where the surfers go and why they are smaller directly inshore of South Branch of Scripps Canyon, a popular beach entry for scuba divers. “Portions of wave crests over the center of a canyon are in deeper water and move ahead faster than the portions on either side. Consequently the waves fan out, resulting in divergence (low waves) over the head of the canyon and convergence (high waves) on either side. … The wave crests bend sharply over the canyon walls. Variations in wave height can be recognized by the prominence of the wave crests on either side of the canyon compared to the crests directly over the canyon and by the variation in the width of the surf zone.” The degree of wave convergence and divergence in this image is indicated by the width of the lines designating wave crests.
From “Refraction of ocean waves: a process linking underwater topography to beach erosion” WH Munk & MA Traylor. Journal of Geology 55(1):1-26, 1947
La Jolla and Scripps Canyons Wave Refraction
Elgar & Raubenheimer’s wave refraction diagram from their Nearshore Canyon Experiment presentation.
Scripps Canyons Wave Refraction Animation, with a bit of La Jolla Canyon
Elgar et al’s fascinating wave refraction animation from SIO NCEX site.
This is a simulation of monochromatic (17s), unidirectional (from 285 deg. T) wave crests propagating across the north (Scripps) canyon (black contour lines). Crests appear in red, troughs in blue. Refraction of wave energy away from the canyon axis results in very low wave heights directly to the east of the canyon head. A wave crest that refracts back to the north of the canyon head interferes with the portion of the same crest that has stayed to the north of the canyon, producing complex interference patterns and high wave heights. More realistic random incident wave conditions do not completely mask these bathymetrically-induced interference patterns as the node and antinode locations change slowly with variations in the incident wave period and direction. In addition, the node and antinode locations are insensitive to the initial phase of the wave crest at the model’s offshore boundary.
Spectral refraction-diffraction simulations produce smaller maximum wave heights north of the canyon, and larger minimum wave heights east of the canyon, when compared to a spectral refraction model. In other words, the role of diffraction is to reduce the extremes (both high and low) of the wave field that would be produced by pure refraction of the incident spectra. Qualitative comparisons of spectral refraction-diffraction results with visual observation of wave heights north of the canyon (ie. feedback from surfers), suggests that the model underpredicts the high wave heights. One potential source of additional wave energy north of the canyon is (unmodeled) reflection from the steep canyon walls.
The Refraction-Diffraction model source code can be obtained from Jim Kirby at http://chinacat.coastal.udel.edu/~kirby/programs/refdif.html.
Other Maps
Oceanside Littoral Cell
A littoral cell is a stretch of coastline containing a complete sedimentation cycle that cycles sand on and off the beaches. Bounded by the beach on one side and extending seaward to just beyond the area of breaking waves, a littoral cell is the region where wave energy dissipates. Sediments from rivers and from coastal erosion as well as plant detritus and garbage are moved southward along the 57 miles of the Oceanside Littoral Cell until these materials encounter the heads of the Scripps and La Jolla Submarine Canyons. These sediments are transported down the canyons; both canyons have extensive detrital mats, particularly in their shallower reaches, consisting of surfgrass and kelp detritus.
1897 map of offshore San Diego
Davidson’s map. La Jolla Canyon was named Soledad Submerged Canyon and Scripps Canyon was unknown.
Davidson’s map. La Jolla Canyon area from large map
Canyon Links
- Nearshore Canyon Experiment [S Elgar et al]
- Nearshore Canyon Experiment Dataset [S Elgar et al]
- NCEX dataset: datapoints are gridded with a resolution of 0.15 x 0.15 seconds (4.6 meters/15 feet).
- La Jolla Canyon and Scripps Canyon images above were produced by Peter Brueggeman using sd150msf_v2.mat dataset and Matlab
- La Jolla Canyon Matlab script, with thanks to Ed Parnell
- Scripps Canyon Matlab script, with thanks to Ed Parnell