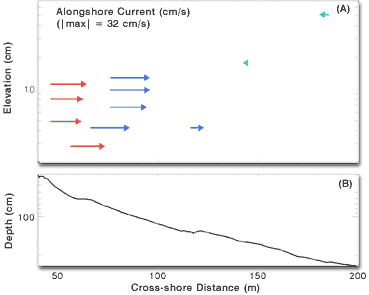
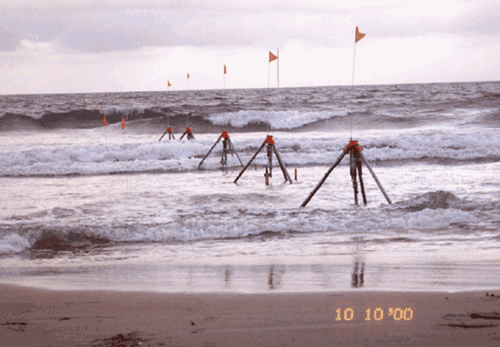
Recent observations (eg, FIGURES 1 & 2) demonstrate that alongshore swashzone currents can be strong. However, there are no field-tested models for alongshore runup velocities.

FIGURE 2: (A) Mean alongshore currents (arrows) observed in the swash (red), surf (blue), and shoaling (green) regions at the elevation above the bed of each sensor, and (B) water depth versus cross-shore distance. Arrows pointing offshore (onshore) represent alongshore currents to the south (north).
Specific objectives for NCEX swash studies include
- determining the magnitude and structure of alongshore swashzone currents.
- testing models of alongshore swashzone currents with field observations.
- examining the range of model validity near regions of large alongshore
gradients of wave height and direction.
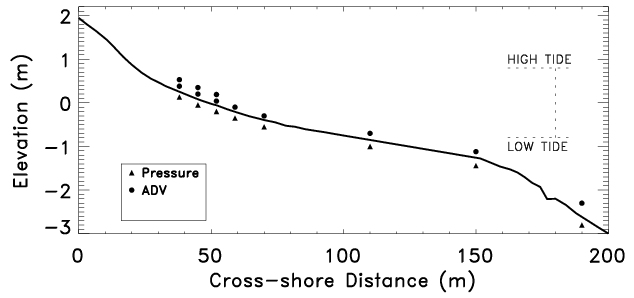
The research plan for NCEX swash studies will include measuring swash and surfzone velocities along a cross-shore transect (FIGURE 3) using 3 sets (separated horizontally) of 2 vertically-stacked small ADV current meters, as well as 5 other ADV current meters. Pressure sensors will be colocated at each instrument station. Surf- and swashzone bathymetry will be measured using a GPS system and a sonar mounted on a jet ski.

