Radar
Nearshore circulation will be imaged with radar during NCEX. A pilot test was performed near the Scripps pier in Fall 2000 using a phased array imaging radar (FIGURE 1) with three linear antennas. Echoes from two vertically separated antenna arrays (the lowest and highest ones in FIGURE 1) also will be combined to infer the height of the water surface.
An example Doppler image (FIGURE 2) and associated time sequence from a pilot test (FIGURE 1) in Fall 2000 near the Scripps pier show waves propagating toward the beach (bottom of FIGURE 2) Time averaging of sequential Doppler velocities at a fixed location yields spatial maps (not shown) of the component of the water velocity along the radar look direction. Two radars looking at the sea surface from different directions are needed to obtain water velocity vectors.
Time sequences (FIGURE 3) of the range of the center beam of the radar show shoaling waves and the break point (range = 200 m) in the power and Doppler. The curvature of the wave crests (bright curves) in range-time coordinates results from the decrease in wave propagation speed as the shoreline is approached. The increase in crest brightness near the shoreline is associated with scattering from the breaking waves.
Comparisons with video recordings (FIGURE 4) show that large backscatter is well correlated with breaking wave pixel intensity in the surfzone. The colored curves are contours of backscatter radar power at 90 (blue) and 100 (red) dB.
FIGURE 1: The phased array imaging radar deployed atop the CCS building was used to observe the nearshore region north of the Scripps pier. The figure shows 3 linear array antennas (long grey boxes) The radar measures the backscattered power and the radial component of water particle velocities.
FIGURE 2: Relative power (left) and Doppler velocity (right) as a function of cross- and alongshore location. Light blue is wave crests.
FIGURE 3: Range versus time of relative power (top) and Doppler velocity (bottom). Light blue is wave crests.
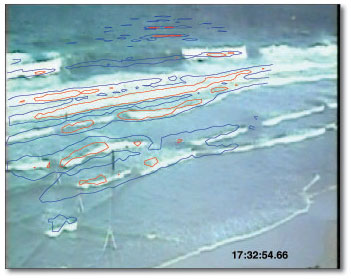
Figure 4
Video
Particle Image Velocimetry
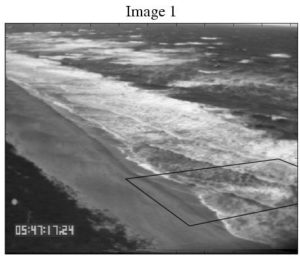
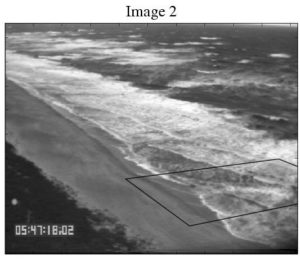
Rip currents often are observed with the naked eye by the contrast between sediment-laden and “foamy” flow within the rip. The surface flow patterns can be quantified using video imagery by interrogating pairs of images separated in time by a small amount. The images are transformed into an ortho-normal plan view using known image-to-ground transformation geometry, and then convolved with a small (order 4-m wide) correlation kernel to determine feature displacements within the area of the kernel. Subsequent filtering operations are performed to remove spurious vectors resulting from poor or noisy correlation matrices. This image analysis is known as Particle Image Velocimetry (PIV). Surface flow can be mapped by observing time series of foam, bubbles, biota, and sediment visible on the water surface, and using PIV techniques to detect advection displacements. An example PIV analysis of two high-oblique images obtained from a stormy day during the 1997 SandyDuck experiment is shown below. (FIGUREs 1 and 2)
-
- Figure 1a

-
- Figure 1b

FIGURE 1: Oblique snapshots of the surf zone separated in time by 0.267 seconds (8 video frames). The outlined region is interrogated with over-lapping 4-m wide correlation convolution kernels and subsequent filtering.
FIGURE 2: The results of the PIV analysis are shown over-laid on the rectified region outlined in Figure 1. The coordinates of the axes are in meters in the FRF coordinate system. The velocity vector magnitudes and directions are consistent with motions qualitatively observed in the video. The maximum vector magnitude is 162 cm/s.
Difficulties arise in the PIV analysis when the resolution of the image is poor. High-oblique views typical of SandyDuck and other past experiments do not provide adequate resolution of image pixels over a large extent of the surf zone. Thus, analysis from these data are restricted to regions close to shore and near the camera. Similarly, for the NCEX experiment, high-oblique views will not have adequate pixel resolution to resolve the flow over a large extent of the surf zone, thus new mounting platforms and strategies will be developed. Directly mounting video over the surf zone using a tethered blimp system will allow adequate resolution over the extent of the surf zone. (FIGURE 3)
FIGURE 3: Photograph of the tethered balloon-mounted camera system deployed next to the SIO pier by G. Deane (SIO) in the summer of 1999. The balloon is similar to that proposed for NCEX. Photograph courtesy of G. Deane (SIO).
Video Remote Sensing
In the fall of 2003, the Coastal Imaging Lab (CIL) will participate in NCEX, a field experiment to study wave dynamics over the abrupt topography of submarine canyons in Southern California. The experiment involves many institutions and will contribute to our understanding of nearshore dynamics, remote sensing in the nearshore and the merging of remotely-sensed data and numerical models of nearshore circulation.
CIL Objectives
The objectives of the Coastal Imaging Lab are:
- to determine the potential for direct estimation of radiation stress gradients from remotely sensed data
- to investigate the potential for merging remotely-sensed data into models of nearshore dynamics
Methods
CIL participation will be based on the use of optical remote sensing from sea-cliff based Argus Stations. In 1994, an Argus Station at Scripps Institution of Oceanography was installed on the roof of IGPP, with a view of the Scripps Pier and the beach to the south. With the planning for NCEX, an NCEX Argus Station was installed in the fall of 2001 to look to the north at the NCEX field area.As of the spring of 2002, we are using three cameras to span the area of interest for NCEX. The camera aim points and lens focal lengths have been chosen to provide coverage of the area with useful resolution.
The NCEX Argus Station will provide two types of data. Image data is useful for measuring the shoreline and sand bar morphology and for detecting rip channels. These are examples of images showing this data. Detection of rips and measurement of their movement through the experiment will be an important part of the NCEX monitoring effort.
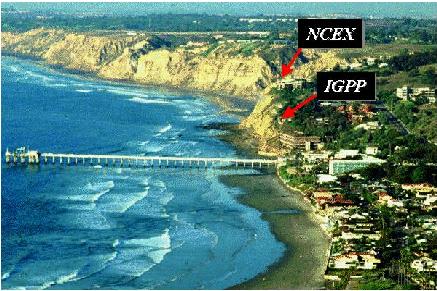
Figure 3b
Argus Stations also provide pixel time series data, useful for making a variety of measurements of waves and currents. An example of the initial NCEX region pixel array shows pixel instruments that will sample approximate bathymetry, mean longshore current, wave period and wave angle. Of particular interest for NCEX will be measurements of spatial variations of wave direction, as waves refract over the complex bathymetry of the submarine canyon. This will require use of many more alpha sub- arrays (measuring wave angle).
NCEX data are kept on ftp at the CIL, available for viewing by any PI.