Field Observations
Field observations from NCEX will be available after data reduction, quality control, and preliminary analysis.
Arrays for NCEX observations are being designed to test hypotheses and models for nearshore processes. Preliminary array designs will evolve as new theoretical and model results become available.
Array Plans for NCEX Field Experiments
FIGURE 1: Overall NCEX Array Plan
The figure above shows preliminary array plans for observing waves and currents near, between, and onshore of the submarine canyons. The contours are depth below mean sea level in m. Numerical model simulations will be used to refine the array plan. Surfzone bathymetry will be measured using a GPS system and a sonar mounted on a waveruner.
FIGURE 2: NCEX Swash Array.
The research plan for NCEX swash studies will include measuring swash and surfzone velocities along a cross-shore transect (FIGURE 2) using 3 sets (separated horizontally) of 2 vertically-stacked small ADV current meters, as well as 5 other ADV current meters. Pressure sensors will be colocated at each instrument station.
FIGURE 3: NCEX Large Scale Video Plan
FIGURE 4: NCEX Rip Current Video Plan
FIGURES 3 & 4: Camera locations and their respective footprints are indicated by the purple dots and black lines, respectively. Depth contours are in 5 m increments from -100 to 50 m relative to mean sea level. Submarine contours are in blue, and sub-aerial contours in red.
The video plan for the large-scale array of cliff mounted video cameras (FIGURE 3) and the small-scale shore-based and balloon-mounted array deployed just onshore of Scripps Canyon (FIGURE 4). Wave breaking patterns and run-up excursions will be measured across the 5 km region. The tethered balloon-mounted camera will be located at number 10 (FIGURE 4).
Field Data
README FILES FOR WHOI-SIO DATA:
- Lat-long, x-y locations, and dates of operation of sensors
- Hourly files w/sensor horizontal and vertical locationns
- Sensor orientations
- Time series
- Processed data products
DATA TRANSFER LINKS:
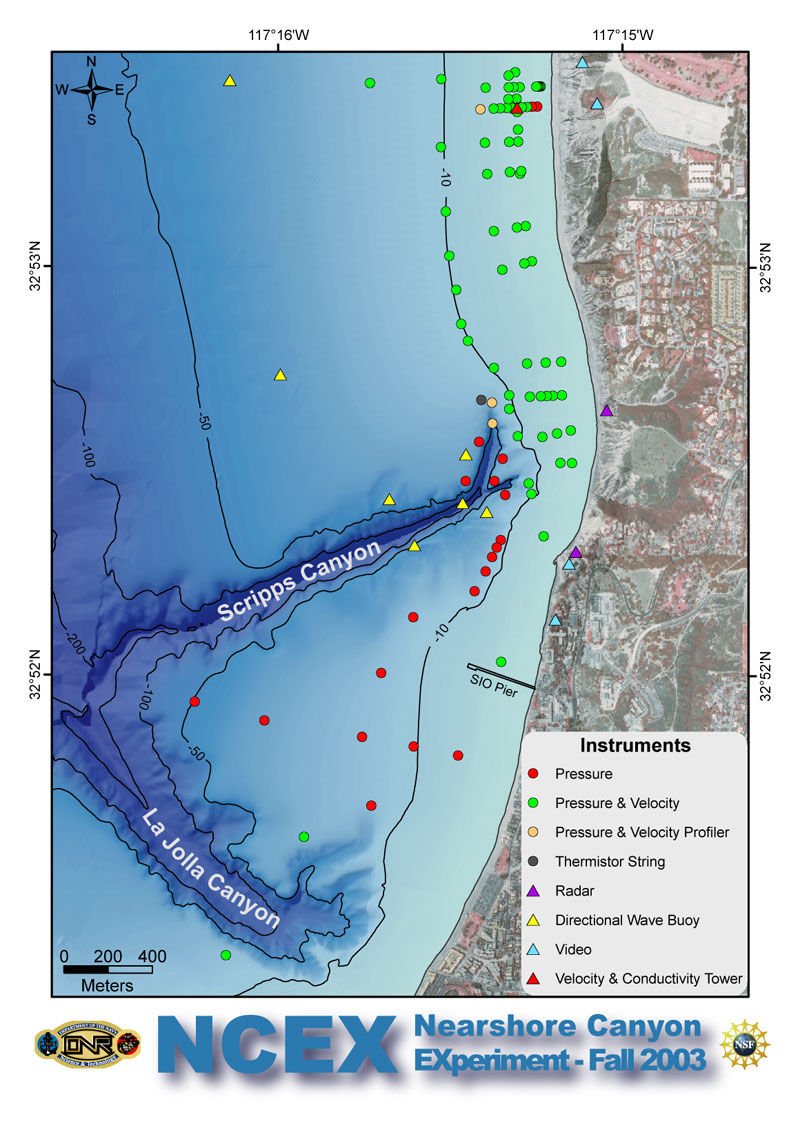
FIGURE 1: Schematic of locations of sensors deployed in the Nearshore Canyon Experiment (NCEX) in Oct and Nov 2003. Time series and processed data products from instruments deployed by Elgar-Guza-Raubenheimer in less than 10-m water depth are available through this WWW site. Links to additional data sets will be posted here when available. The colors are depth contours (relative to mean sea level, as indicated by the labeled contour curves). Symbols are wave and current sensors (see legend).
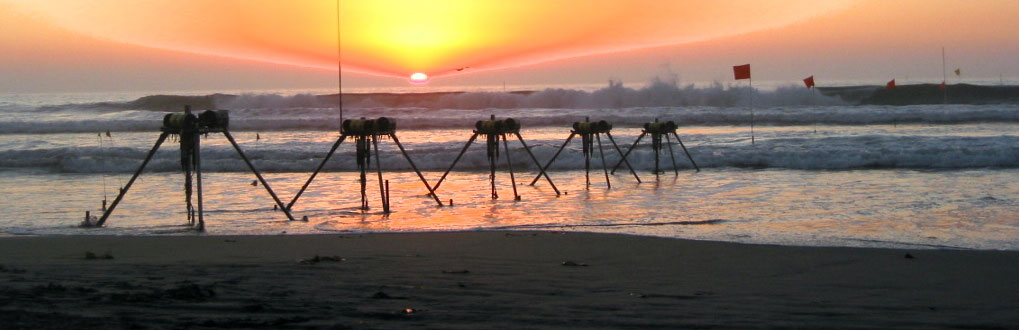
FIGURE 2: A cross-shore transect at the northern edge of the NCEX study area. The 5 tripods in the foreground hold vertical stacks of 2-axis ADVs with colocated pressure sensors for observing waves and currents in the swashzone. The array extends from the shoreline to 15 m water depth (tripods that hold 3-axis ADVS and colocated pressure sensors are marked with orange flags across the surfzone).
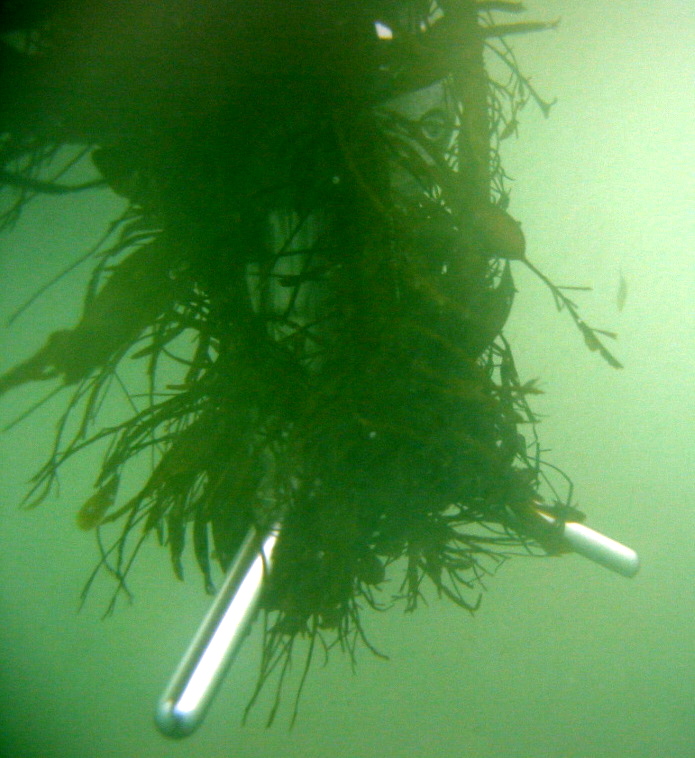
FIGURE 3: Kelp on the acoustic transducer arms of a SONTEK ADV deployed during NCEX. The data on this WWW site have undergone extensive quality control (» see Elgar, Steve, B. Raubenheimer, & R.T. Guza, 2005, Quality control of acoustic Doppler velocimeter data in the surfzone, Measurement Science and Technology 16, 1889-1893.). However, there are no guarantees that the quality control processing was perfect. If you find questionable data, please contact Steve Elgar (elgar@whoi.edu) or Britt Raubenheimer (britt@whoi.edu) so we can investigate further.