Aerial photograph of complex nearshore circulation near Scripps and La Jolla Submarine Canyons on the Southern California coast. There is a strong offshore flowing rip current to the south (left) of the 340-m long Scripps Institution of Oceanography pier, as well as smaller jets, eddies, and meanders (eg, outside the surfzone (white foam) north of the pier). Recent rains resulted in a strong color contrast between sediment-laden nearshore water and the clearer blue waters farther offshore.
During NCEX models for horizontal surfzone and swashzone circulation will be compared with observations acquired with in situ sensors, drifters, and remote sensors located on the shoreline and overhead.
Complex Nearshore Circulation
-

- Aerial photograph of complex nearshore circulation near Scripps and La Jolla Submarine Canyons on the Southern California coast. There is a strong offshore flowing jet to the south (left) of the 340-m long Scripps Institution pier, as well as smaller jets, eddies, and meanders (eg, outside the surfzone (white foam) north of the pier). Recent rains resulted in a strong color contrast between muddy nearshore water and the clearer blue waters farther offshore.
-

- Close up of the circulation near the pier. The approximately 1 km long jet of muddy water (south (left) of the pier) is 10’s of m wide at the offshore end. Smaller jets and eddies can be seen at the seaward edge of the surfzone (delineated by the white foam from breaking waves).
-

- An offshore directed jet originating close to Black’s Beach, onshore of the northern head of Scripps Submarine Canyon, a few km north of the Scripps Institution of Oceanography pier.
-
- Close up of the offshore flow near Black’s Beach. The offshore tip of the jet has curled into a tight eddy that is being swept south (to the right) by alongshore flows.
-

- Complex pattern of swell at Black’s Beach near the northern head of the Scripps Submarine Canyon. Offshore (blue water), the swell crests were long, straight, and approximately parallel to the coastline. The two wave crests near the lower left-hand corner of the photograph are propagating at a large oblique angle relative to the shoreline, while adjacent waves approach the beach nearly parallel to the shoreline.
-
- Close up of the complex pattern of swell at Black’s Beach near the northern head of the Scripps Submarine Canyon. Curving wave crests can be seen in the muddy water between the surfzone (white foam) and blue offshore water. Waves refracted by the complex canyon bathymetry can propagate at large angles to shore normal, and drive complicated surfzone circulation.
Horizontal Currents
The alongshore gradients in waves caused by the steep canyon bathymetry result in complex surfzone circulation.
Bathymetry-induced gradients in waves cause:
- Alongshore gradients in surfzone width and setup
- Complex circulation
- alongshore currents (surf and swash)
- jets, rips
- Sediment transport
Models for mean cross- and alongshore currents will be tested with observations acquired with in situ current meters, shore-based video and radar, directional buoys, pressure gages, and surface drifters.
Vertical Structure
FIGURE 1: Schematic of the Vertical Array Sensor System used to investigate the vertical structure of velocity, bubbles, and suspended sediment in the surf zone.
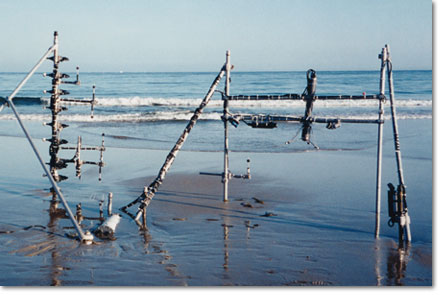
FIGURE 2: A photograph of the Vertical Array Sensor System showing stacks of two-component, electromagnetic current sensors and conductivity cells to measure velocities and void fraction (air bubble content) from the bed to the surface. Local bottom morphology is mapped over a 2 m square by a raster-scanning altimeter, and out to 10 m radius by a rotating side scan sensor. All sensors are sampled at 20 Hz and the data streams are sent to shore-based computers through a fiber optic link. The sensors sample the entire surf zone at a fixed location as the 2 m tide rises and falls (see Figure 3)
FIGURE 3: Cross-shore array of pressure gages and current meters (puv’s) to place the fixed vertical array measurements (Figures 1 and 2) in temporal and spatial perspective. Additionally, 5 puv’s in an alongshore array (not shown) will measure infragavity waves and shear instabilities of the longshore current.
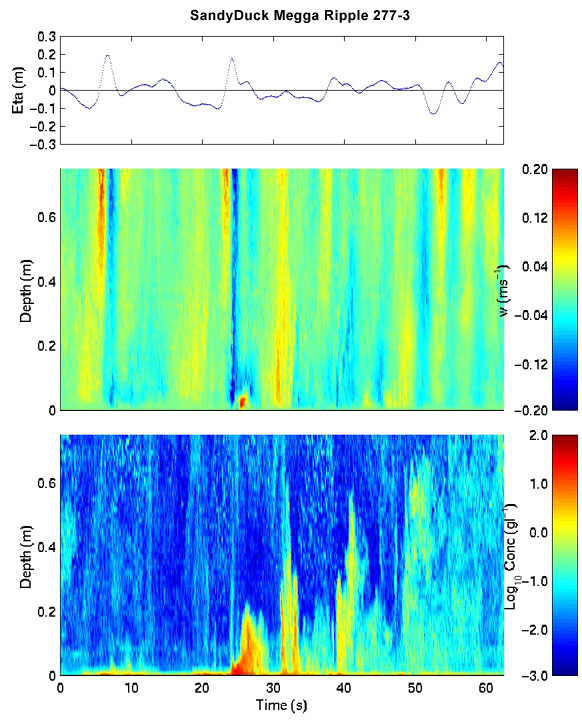
FIGURE 4: Sea-surface elevation versus time (upper panel) and vertical velocity (middle panel) and sediment concentration (bottom panel) as a function of depth and time. Sediment concentration and 3-components of velocity were acquired at 20 Hz in 1-cm (vertical) bins over the lower 60 cm of the water column with a Bistatic Coherent Doppler Velocity and Sediment Profiler (BCDVSP).